

Typically, a discussion of technical analysis must start with the Dow Theory. Charles Dow was one of the fathers of modern trading, and his name is still remembered today in the Dow Jones Industrial Average, one of the leading stock market indices that is often simply called the “Dow”. It still measures the stock performance of 30 large companies listed on stock exchanges in the United States.
Dow teamed up with Edward Jones in 1882, forming a business that delivered a handwritten newsletter to banks and brokerages. This became known as the Wall Street Journal in 1889 and is still in publication.
Dow wrote many articles about the markets, which always fascinated him, and he decided to put together an average of stock values in 1884. To Dow, this provided a ready means to indicate the health of the business community.
The first average was made up of 11 stocks, nine of which were railroad stocks. In 1896, Dow decided to split out the transportation stocks into a separate index, and that is when the Dow Jones Industrial Average (DJIA) and the Dow Jones Transportation Average (DJTA) came into being.
Dow always considered that both of these indexes had to be moving in the same direction to confirm a trend, whether up or down. He would not believe in a trend until they were moving together and considered the trend continuing until both reversed.
This is based on sound logic. If manufacturing is up, as indicated by a rise in the Industrial Average, then there is more transportation required and the Transportation Average should be increasing too. Anything else suggests an unstable situation. This idea is often summed up in the expression “what one makes, the other takes.”
Principles of Dow Theory
The Dow Theory is made up of six basic principles. Let’s understand the principles of Dow Theory.
Principle 1: The Stock Market Discounts All Information
The first principle of Dow Theory suggests that stock price represents sum total of hopes, fears and expectation of all participants and stock prices discounts all information that is known about stock i.e. past, current and above all stock price discounts future in advance i.e. the stock market makes tops and bottoms ahead of the economy.
It suggests the stock market discounts all information be it interest rate movement, macroeconomic data, central bank decision, future earnings announcement by the company, etc. The only information which the stock market does not discount is natural calamities like tsunami, earthquake, cyclone, etc.
Principle 2: The Stock Market Have Three Trends
Dow Theory says the stock market is made up of three trends
a. Primary Trend
b. Secondary trend
c. Minor Trend
Dow Theory says the primary trend is the main trend and trader should trade in the direction of this trend. It says the primary trend is the trader’s best friend which would never ditch trader in this volatile stock market. If the primary trend is rising then the trend is considered rising (bullish) else trend is considered falling (bearish). The primary trend is the largest trend lasting for more than a year.
The primary trend is considered rising if each peak in the rally is higher than the previous peak in the rally and each trough in the rally is higher than the previous trough in the rally. In other words, as long as each successive top is higher than the previous top and each successive bottom is higher than the previous bottom, the primary trend is considered rising and we say markets are bullish.
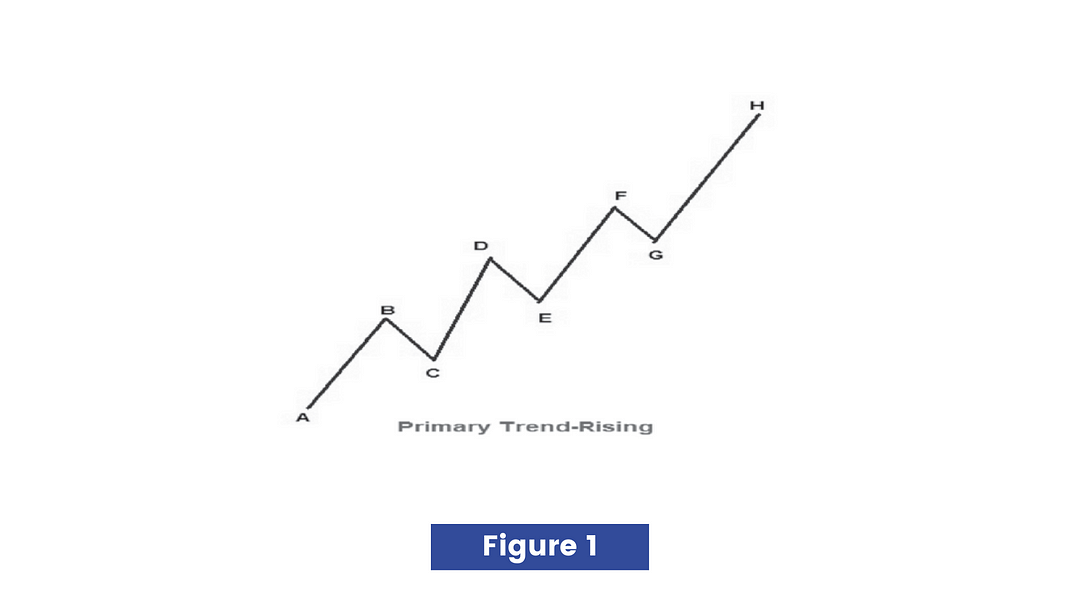
This figure illustrates that each successive top that is D, F, and H are higher than previous tops, and each successive bottom that is E and G is higher than previous bottoms, hence primary trend is considered rising.
The primary trend is considered falling if each peak in the rally is lower than the previous peak in the rally and each trough in the rally is lower than the previous trough in the rally. In other words, as long as each successive bottom is lower than the previous bottom and each successive top is lower than the previous top, the primary trend is considered falling and we say markets are bearish.
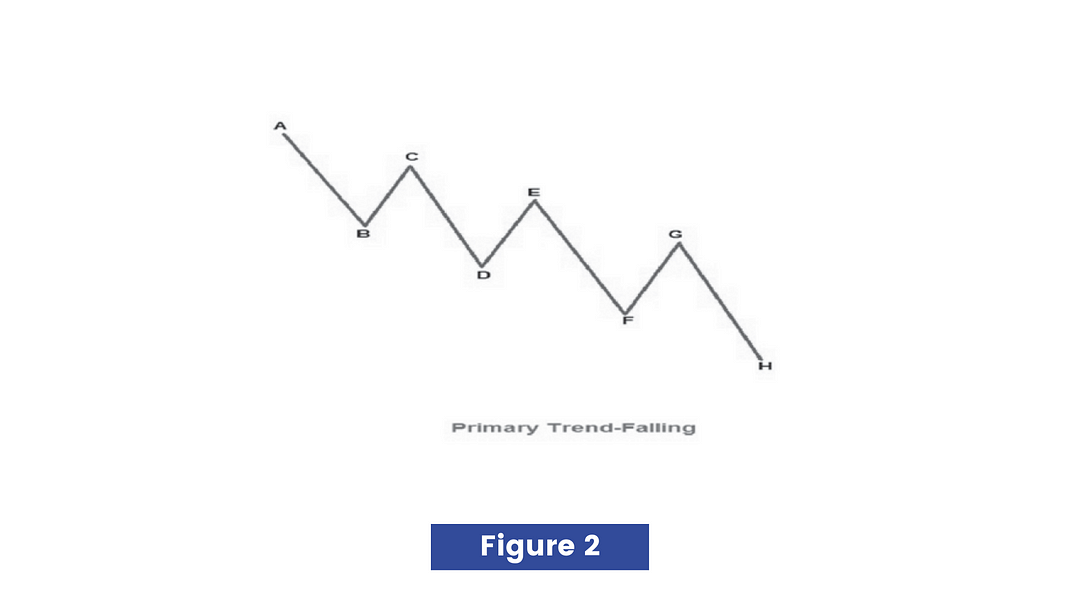
The figure illustrates that each successive bottom that is D, F, and H are lower than previous bottoms, and each successive top that is E and G are lower than previous tops, hence the primary trend is considered falling.
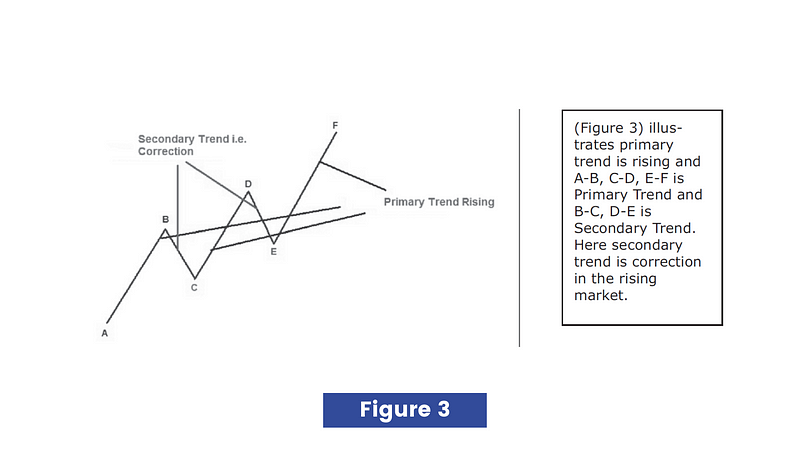
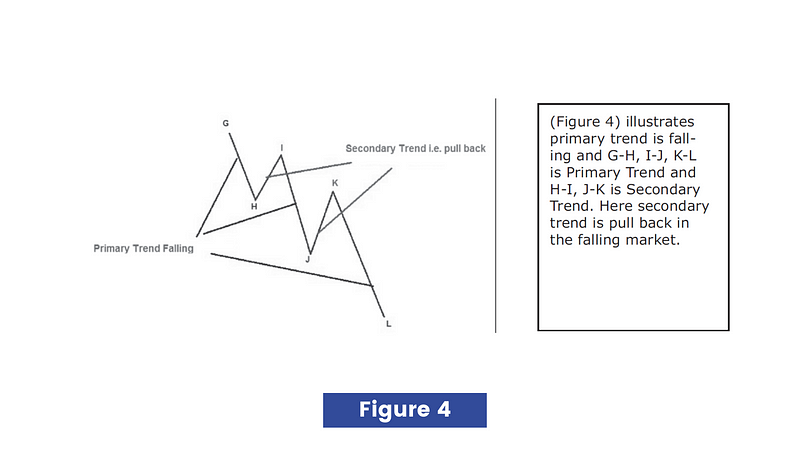
Dow Theory says secondary trends are found within the primary trend i.e. corrections when the primary trend is rising and pullback when the primary trend is falling. The more precisely secondary trend is the movement against the direction of the primary trend. The secondary trend usually lasts for three weeks to three months. See the figures below.
Dow Theory says that the secondary trend consists of short term price movements which is known as minor trends. The minor trend is generally the corrective move within a secondary trend, more precisely moves against the direction of the secondary trend. The minor trend usually lasts for one day to three weeks. The Dow Theory says minor trends are unimportant and need no attention. If too much focus is placed on minor trends, it can lead to a total loss of capital as a trader gets trapped in short term market volatility.
Principle 3: Primary Trend Have Three Phases
The Dow Theory says the primary trend has three phases
a. Accumulation Phase
b. Participation Phase
c. Distribution Phase
The Dow Theory says that the accumulation phase is made up of buying by the intelligent investor who thinks stock is undervalued and expects economic recovery and long term growth. During this phase, environment is totally pessimistic and the majority of investors are against equities and above all nobody at this time believes that the market could rally from here. This is because the accumulation phase comes after a significant down move in the market and everything appears at its worst. Practically this is the beginning of the new bull market.
The participation phase is characterized by improving fundamentals, rising corporate profits, and improving public sentiment. More and more traders participate in the market, sending prices higher. This is the longest phase of the primary trend during which the largest price movement takes place. This is the best phase for the technical trader.
The distribution phase is characterized by too much optimism, robust fundamentals and above all nobody at this time believes that the market could decline. The general public now feels comfortable buying more and more in the market. It is during this phase that those investors
who bought during the accumulation phase begin to sell in anticipation of a decline in the market. This is the time when Technical Analyst should look for a reversal in the trend to initiate sell-side positions in the stock market.
Three phases of the primary trend :
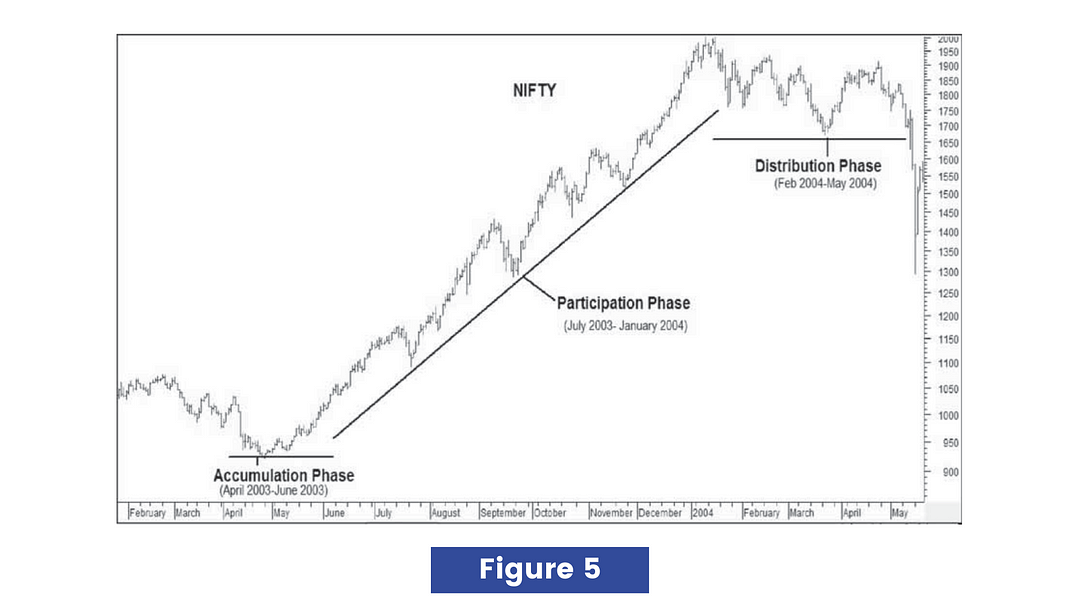
In this figure you can see that:
· Accumulation phase from April 2003 to June 2003 during which nobody believed that markets could rally but intelligent investors took buy-side positions in the stock market.
· Participation phase from July 2003 to January 2004 during which the largest and longest price movement occurred.
· Distribution phase from February 2004 to May 2004 during which smart money closed buy-side positions in the market.
Principle 4: Stock Market Indexes Must Confirm Each Other
Charles H Dow believed that the stock market as a whole reflected the overall business condition of the country. In other words, the stock market as a whole is a benchmark indicator to measure the economic condition of the country.
Dow first used the basis of his theory to create two indexes namely (i) Dow Jones Industrial Index and (ii) Dow Jones Rail Index (now Transportation Index). Dow created these two indexes because those days U.S was a growing industrial nation and urban centers and production centers were apart. Factories have to transport their goods to urban centers by railroad. Hence these two indexes covered two major economic segments i.e. Industrial and transportation.
Dow felt these two indexes would reflect true business conditions within the economy.
According to Dow
(a) Rise in these two indexes reflects that overall business condition of the economy is good
The basic concept behind this is that if production is increasing then the transportation of goods to the customer should also increase i.e. performance of companies transporting goods to the consumer should improve. According to Dow Theory, two averages should move in the same direction and the rising Industrial Index is not sustainable as long as Transportation Index is not rising.
(b) The divergence in these two indexes is a warning signal.
Under Dow Theory, a reversal from a bull market to bear market or vice versa is not signaled until and unless both indexes i.e. Industrial Index and Transportation Index confirm the same.
In simple words, if one index is confirming a new primary uptrend but another index remains in a primary downtrend, then there is no clear trend.
Basically Dow Theory says that the stock market will rise if business conditions are good and the stock market would decline if business conditions are poor.
Principle 5: Volume Must Confirm the Trend
Dow Theory says that trend should be confirmed by the volume. It says volume should increase in the direction of the primary trend i.e.
· If the primary trend is down then volume should increase with the market decline.
· If the primary trend is up then volume should increase with the market rally.
Basically, the volume is used as a secondary indicator to confirm the price trend and once the trend is confirmed by volume, one should always remain in the direction of the trend.
Principle 6: Trend Remains Intact Until and Unless Clear Reversal Signals Occur
As we are dealing in the stock market which is controlled by only one “M” i.e. Money and this money flows very fast across borders. Hence stock prices do not move smoothly in a single line, one day it’s up the next day it might be down.
For a physical comparison, simply look at Newton’s Laws of Motion, which state that an object will keep moving unless acted upon by an external force. There is usually a discernible reason why trends come to an end.
Dow was not strictly a trader but looked at the long-term outcome. The fundamentals of Technical Analysis are usually summarized in the following three beliefs.
Basically Dow Theory suggests that one should never assume reversal of the trend until and unless clear reversal signals are there and one should always trade in the direction of the primary trend.
Significance of Dow Theory
It’s Dow Theory which gave birth to the concept of higher top-higher bottom formations and lower top-lower bottom formations which is the basic foundation of Technical Analysis. This helps investors to improve their understanding of the market so that they could succeed in their investment/trading decisions. Most of the technical analysts follow this concept and if you go through any technical write up, you would definitely find this concept.
Learn more about Technical Analysis here
For more articles, Join Free Market notes telegram channel here
Akshay Seth
Research Analyst (SEBI Regd.)
Linkedin | [email protected]
Reference: NCFM technical analysis module provided by NSE India, Technical Analysis A Newbies' Guide by Alan Northcott